K-Nearest Neighbors (KNN) is a simple yet effective machine-learning algorithm that classifies a data point based on the majority label of its k nearest neighbors. However, the choice of k directly influences how well the model balances bias and variance.
Dataset Used: Iris Dataset (contains 150 samples across 3 flower species — Setosa, Versicolor, and Virginica)
Features: Sepal length, Sepal width, Petal length, Petal width
Distance Metric: Euclidean Distance
Validation Technique: 10-Fold Cross-Validation
Software: Weka
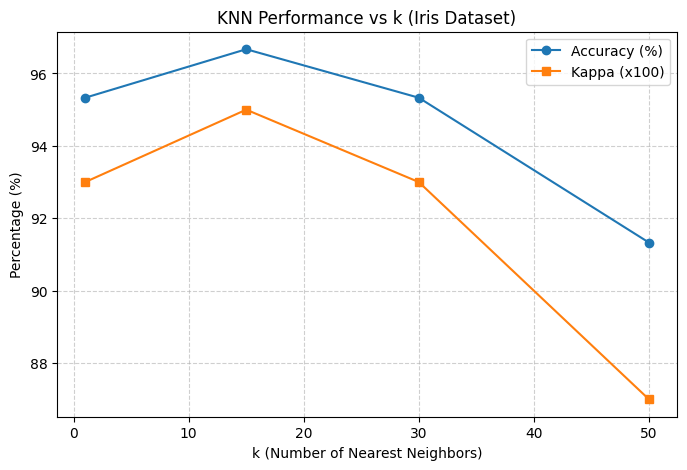
| k | Accuracy (%) | Kappa | MAE | RMSE |
|---|---|---|---|---|
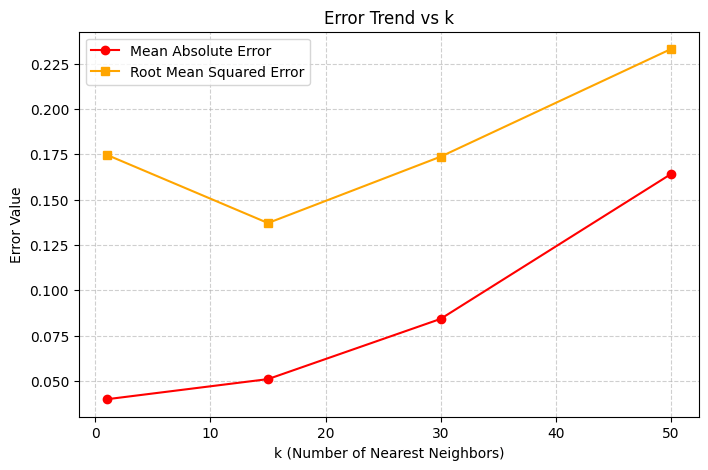
| 1 | 95.33 | 0.93 | 0.0399 | 0.1747 |
| 15 | 96.67 | 0.95 | 0.0510 | 0.1371 |
| 30 | 95.33 | 0.93 | 0.0842 | 0.1737 |
| 50 | 91.33 | 0.87 | 0.1640 | 0.2330 |
Accuracy: Percentage of correctly classified samples.
Cohen’s Kappa: Measures agreement between predicted and actual labels, adjusting for chance.
MAE (Mean Absolute Error): Measures average magnitude of classification error.
RMSE (Root Mean Squared Error): Penalizes large misclassifications more heavily.
Visualization:
Interpretation:
- Accuracy and Kappa improve up to k = 15, then drop after that.
- MAE and RMSE are lowest at k = 15, confirming it’s the most balanced choice.
My Conclusion
When k is too small, the algorithm reacts to noise, causing overfitting.
When k is too large, it smooths over important local patterns, leading to underfitting.
An intermediate k = 15 offers the best trade-off between these two extremes.

Leave a comment